How To Write Fast Rust Code
Author: Christopher Sebastian
Date: 2020-01-17
Contents
- The Journey from
evaltofasteval - Basic Skill #1: How To Take Noise-Free Measurements
- Basic Skill #2: How to Profile with
perf - Performance Tip #1: Compile with
RUSTFLAGS="--emit=asm" - Performance Tip #2: Optimize the Critical Path
- Performance Tip #3: Reduce Redundant Work
- Comments
The Journey from eval to fasteval
I did a line-for-line port of my eval library from Go to Rust, and right away it was 5x faster; I was pretty happy. But when I tried to further improve performance using techniques from other languages, it got slower... and the harder I tried, the slower it got! Rust performance was not intuitive to me.
Finally, after learning why my code was slow, I was able to boost performance 12000x, and my library was worthy of a new name: fasteval.
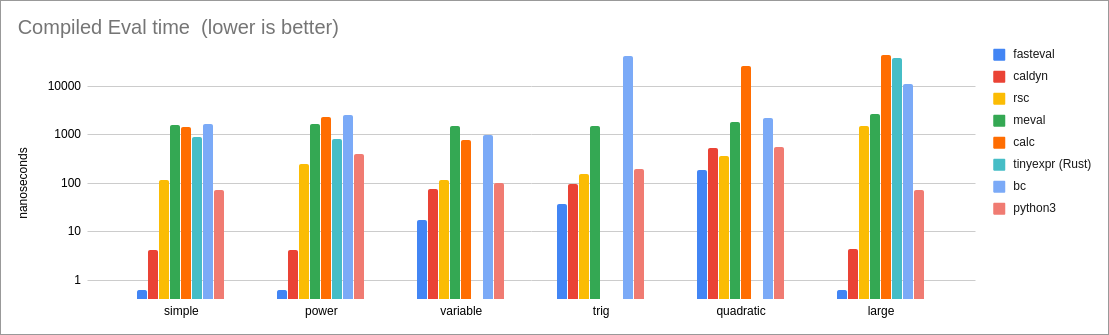
Here is a log chart showing fasteval's performance compared to other similar libraries. fasteval is represented by the little blue columns, and as you can see, it is significantly faster.
Rust performance makes sense to me now. Here are the lessons I learned.
Basic Skill #1: How To Take Noise-Free Measurements
ALWAYS PERFORM A release BUILD OF YOUR PROGRAM WHEN MEASURING PERFORMANCE. Measurements from a non-release build will be very misleading.
The first step to improving performance is to measure, measure, measure... but these measurements will be affected by many variables. I try to eliminate three of them: Background Applications, Power Management, and Binary Layout.
Background Applications
This one's easy: close all the background apps, especially web browsers which constantly consume cycles from all your CPU cores.
CPU Power Management
Here is how I disable power-saving mode on Ubuntu 18.04:
for F in /sys/devices/system/cpu/cpufreq/policy*/scaling_governor; do echo performance >$F; done
Layout Randomization
The compiler often makes poor decisions about the placement of your code within the binary, and your performance suffers. To mitigate this, I use a Layout Randomization technique similar to Coz: during each iteration of my benchmark loop, I inject a random number of no-op instructions into my benchmark code (using sed). This shifts everything around in the address space so that I end up hitting all fast and slow scenarios. I then run the benchmark loop many times, until I no longer observe any performance improvements for 500 seconds. (This usually takes around 15 minutes on my system.) At that point, I say that I have reached a stable point and can draw conclusions from the statistics.
I define this macro in my benchmark code:
#![feature(test)]
extern crate test;
use test::{Bencher, black_box};

macro_rules! memshift {
    () => {
        {
            let x = black_box(0);
            let x = black_box(x+1);

            //SHIFT_CODE

            black_box(x);  // Silence 'unused variable' warning.
        }
    }
}
I then call memshift!(); at the beginning of all benchmark functions.
Here is my benchmark loop, which performs Layout Randomization:
while true; do
    echo "time: $(date +%s)";
    cat bench.rs.tmpl | sed "s|//SHIFT_CODE|$( N=$(( 1 + $RANDOM % 1024 ));
                                               while [[ $N > 0 ]]; do
                                                   N=$(( $N - 1 ));
                                                   echo -n 'let x=black_box(x+1);';
                                               done )|g" >bench.rs;
    RUSTFLAGS="--emit=asm" cargo bench;
done >bench.out
I monitor the results with this:
cat bench.out | awk -v "now=$(date +%s)" '
    $1=="time:"{when=$2}
    $3=="..." && $4=="bench:" {
        gsub(/,/, "", $5);
        v=$5+0;
        counts[$2]+=1; sums[$2]+=v;
        if (mins[$2]=="" || v<mins[$2]) {
            mins[$2]=v; w[$2]=when;
        }
    }
    END{
        printf "%-40s %9s %9s %16s\n", "000_NAME", "MEAN", "MIN", "WHEN";
        for (k in mins) {
            printf "%-40s %9d %9d ns/iter    %5ds ago\n",k,sums[k]/counts[k],mins[k],now-w[k];
        }
    }
' | sort
I use the 'minimum' times as my final result. The 'mean' times help to verify that a 'minimum' is not overly-optimistic due to CPU branch prediction. This approach is simple and is not affected by transient system background activity. By following this process, my benchmark results are very consistent -- often equal-to-the-nanosecond! This makes it very easy to know whether a change helps performance or not.
Basic Skill #2: How to Profile with perf
A profiler tells you where your performance bottlenecks are. Here is a quick tutorial of how I profile with perf on Linux. If you already know how to profile your code, you can skip to the Performance Tips section.
First, write a loop that performs the operation that you are trying to measure. The longer you run your loop, the better your statistics will be. Here's an example of evaluating an expression with fasteval. (If you are curious or confused about this code, see the fasteval examples.):
fn main() -> Result<(), fasteval::Error> {
    // 20 million iterations will be long enough for this example.
    for _ in 0..20_000_000i64 {
        // Evaluate a simple expression:
        let val = fasteval::ez_eval("3^2 + 1", &mut fasteval::EmptyNamespace)?;

        assert_eq!(val, 10.0);
    }

    Ok(())
}
Let's see how fast this is:
user@asus:~/tmp/github.com/fasteval$ cargo build --release
user@asus:~/tmp/github.com/fasteval$ time cargo run --release
real    0m9.187s
user    0m9.183s
sys     0m0.004s
It took a bit over 9 seconds to run 20 million iterations. It's ok, but we can do much better. Let's use perf to see where most of the time is spent:
$ # Pre-Compile so compilation is not included in the profile:
$ cargo build --release

$ # Capture a performance profile:
$ perf record --call-graph dwarf -- cargo run --release

$ # View the profile statistics:
$ perf report


Samples: 1K of event 'cycles:ppp', Event count (approx.): 49289530718
  Children      Self  Command   Shared Object       Symbol
+   88.43%     2.71%  perfdemo  perfdemo            [.] fasteval::ez::ez_eval
+   87.34%     0.34%  perfdemo  perfdemo            [.] perfdemo::main
+   87.34%     0.00%  perfdemo  perfdemo            [.] _start
+   87.34%     0.00%  perfdemo  libc-2.27.so        [.] __libc_start_main
+   87.34%     0.00%  perfdemo  perfdemo            [.] main
+   87.34%     0.00%  perfdemo  perfdemo            [.] std::rt::lang_start_internal
+   87.34%     0.00%  perfdemo  perfdemo            [.] std::panic::catch_unwind (inlined)
+   87.34%     0.00%  perfdemo  perfdemo            [.] std::panicking::try (inlined)
+   87.34%     0.00%  perfdemo  perfdemo            [.] __rust_maybe_catch_panic
+   87.34%     0.00%  perfdemo  perfdemo            [.] std::panicking::try::do_call
+   87.34%     0.00%  perfdemo  perfdemo            [.] std::rt::lang_start_internal::_$u7b$$u7b$closure$u7d$$u7d$::h7508d080ecc0582e (inlined)
+   87.34%     0.00%  perfdemo  perfdemo            [.] std::rt::lang_start::_$u7b$$u7b$closure$u7d$$u7d$::h56279dc72bc5209a
+   31.34%     9.12%  perfdemo  perfdemo            [.] fasteval::parser::Parser::read_expression
+   28.87%     0.00%  perfdemo  libc-2.27.so        [.] __GI___libc_malloc (inlined)
+   23.80%    13.86%  perfdemo  perfdemo            [.] <fasteval::parser::Expression as fasteval::evaler::Evaler>::eval
+   22.10%     6.29%  perfdemo  perfdemo            [.] fasteval::parser::Parser::read_value
+   15.93%    13.37%  perfdemo  libc-2.27.so        [.] _int_malloc
+   13.04%     8.87%  perfdemo  perfdemo            [.] core::num::dec2flt::dec2flt
+   11.77%    11.77%  perfdemo  libc-2.27.so        [.] malloc
+    8.76%     8.76%  perfdemo  [kernel]            [k] 0xffffffff93e018f0
+    8.58%     0.00%  perfdemo  libc-2.27.so        [.] __GI___libc_free (inlined)
+    7.82%     7.82%  perfdemo  libc-2.27.so        [.] cfree@GLIBC_2.2.5
+    5.90%     0.00%  perfdemo  libc-2.27.so        [.] __memcpy_sse2_unaligned_erms (inlined)
+    5.78%     5.78%  perfdemo  libc-2.27.so        [.] __memmove_sse2_unaligned_erms
+    4.83%     1.83%  perfdemo  perfdemo            [.] core::ptr::real_drop_in_place
+    4.15%     4.12%  perfdemo  perfdemo            [.] <f64 as core::num::dec2flt::rawfp::RawFloat>::short_fast_pow10
+    3.88%     0.00%  perfdemo  libc-2.27.so        [.] _int_free (inlined)
+    2.64%     0.00%  perfdemo  [kernel]            [k] 0xb9430a98c55210ff
+    1.95%     0.00%  perfdemo  [unknown]           [.] 0xffffffffffffffff
+    1.86%     0.00%  perfdemo  [unknown]           [.] 0x00007ffeb2f692c7
+    1.84%     0.00%  perfdemo  perfdemo            [.] _fini
+    0.93%     0.90%  perfdemo  perfdemo            [.] fasteval::evaler::<impl fasteval::parser::BinaryOp>::binaryop_eval
+    0.89%     0.88%  perfdemo  perfdemo            [.] core::num::dec2flt::parse::parse_decimal
     0.83%     0.37%  perfdemo  perfdemo            [.] <alloc::vec::Vec<T> as core::ops::drop::Drop>::drop
+    0.80%     0.00%  perfdemo  [unknown]           [.] 0x4023ffffffffffff
+    0.72%     0.72%  perfdemo  perfdemo            [.] __rdl_alloc
+    0.72%     0.00%  perfdemo  perfdemo            [.] std::sys::unix::alloc::<impl core::alloc::GlobalAlloc for std::alloc::System>::alloc (inlined)
+    0.71%     0.71%  perfdemo  perfdemo            [.] core::ptr::real_drop_in_place
+    0.67%     0.04%  perfdemo  libm-2.27.so        [.] __pow
     0.64%     0.64%  perfdemo  perfdemo            [.] core::num::dec2flt::extract_sign
     0.58%     0.25%  perfdemo  libm-2.27.so        [.] __ieee754_pow_sse2
+    0.52%     0.00%  perfdemo  [unknown]           [.] 0x00007ffeb2f68cbf
+    0.50%     0.00%  perfdemo  [unknown]           [.] 0x00007ffeb2f68fe7
     0.33%     0.33%  perfdemo  [kernel]            [k] 0xffffffff93e009a7
     0.30%     0.00%  perfdemo  [unknown]           [.] 0x00007ffeb2f6906f
     0.23%     0.00%  perfdemo  [unknown]           [.] 0x000055ba1c29eb97
     0.21%     0.00%  perfdemo  libc-2.27.so        [.] tcache_get (inlined)
     0.20%     0.00%  perfdemo  [unknown]           [.] 0x0000000000000007
     0.16%     0.15%  perfdemo  perfdemo            [.] core::ptr::real_drop_in_place
     0.15%     0.08%  perfdemo  perfdemo            [.] core::ptr::real_drop_in_place
     0.12%     0.00%  perfdemo  libc-2.27.so        [.] tcache_put (inlined)
From the above report, I can see that much of the time is spent on memory operations:
28.87%/??.??% __GI___libc_malloc (inlined)15.93%/13.37% _int_malloc11.77%/11.77% malloc-
8.58%/ ?.??% __GI___libc_free (inlined) -
7.82%/ 7.82% cfree@GLIBC_2.2.5 -
5.90%/ ?.??% __memcpy_sse2_unaligned_erms (inlined) -
5.78%/ 5.78% __memmove_sse2_unaligned_erms -
3.88%/ ?.??% _int_free (inlined)
fasteval allows you to use a Slab -- a pre-allocated block of memory, which can eliminate most of the above memory operations and also allows us to save the parse results so we don't need to repeat the parse in the loop:
use fasteval::Evaler;  // use this trait so we can call eval().
fn main() -> Result<(), fasteval::Error> {
    // Allocate a block of memory:
    let mut slab = fasteval::Slab::new();

    // Pre-parse the expression, placing it into `slab`:
    let parser = fasteval::Parser::new();
    let expr_ref = parser.parse("3^2 + 1", &mut slab.ps)?.from(&slab.ps);

    for _ in 0..20_000_000i64 {
        // Evaluate the pre-parsed expression:
        let val = expr_ref.eval(&slab, &mut fasteval::EmptyNamespace)?;

        assert_eq!(val, 10.0);
    }

    Ok(())
}
How is the performance now?
$ time cargo run --release
real    0m1.899s
user    0m1.895s
sys     0m0.004s
It's getting better -- now it takes less than 2 seconds to run 20 million iterations. Let's do one more profiling pass:
$ perf record --call-graph dwarf -- cargo run --release
$ perf report


Samples: 258  of event 'cycles:ppp', Event count (approx.): 12442799113
  Children      Self  Command   Shared Object       Symbol
+   91.56%    41.60%  perfdemo  perfdemo            [.] <fasteval::parser::Expression as fasteval::evaler::Evaler>::eval
+   90.00%     0.00%  perfdemo  perfdemo            [.] _start
+   90.00%     0.00%  perfdemo  libc-2.27.so        [.] __libc_start_main
+   90.00%     0.00%  perfdemo  perfdemo            [.] main
+   90.00%     0.00%  perfdemo  perfdemo            [.] std::rt::lang_start_internal
+   90.00%     0.00%  perfdemo  perfdemo            [.] std::panic::catch_unwind (inlined)
+   90.00%     0.00%  perfdemo  perfdemo            [.] std::panicking::try (inlined)
+   90.00%     0.00%  perfdemo  perfdemo            [.] __rust_maybe_catch_panic
+   90.00%     0.00%  perfdemo  perfdemo            [.] std::panicking::try::do_call
+   90.00%     0.00%  perfdemo  perfdemo            [.] std::rt::lang_start_internal::_$u7b$$u7b$closure$u7d$$u7d$::h7508d080ecc0582e (inlined)
+   90.00%     0.00%  perfdemo  perfdemo            [.] std::rt::lang_start::_$u7b$$u7b$closure$u7d$$u7d$::h56279dc72bc5209a
+   90.00%     0.21%  perfdemo  perfdemo            [.] perfdemo::main
+   35.02%     0.00%  perfdemo  libc-2.27.so        [.] __GI___libc_free (inlined)
+   27.18%    27.18%  perfdemo  libc-2.27.so        [.] cfree@GLIBC_2.2.5
+   26.57%     0.00%  perfdemo  libc-2.27.so        [.] _int_free (inlined)
+   17.36%     0.00%  perfdemo  libc-2.27.so        [.] tcache_put (inlined)
+    9.74%     9.74%  perfdemo  [kernel]            [k] 0xffffffff93e018f0
+    7.47%     7.37%  perfdemo  libm-2.27.so        [.] __pow
+    7.27%     7.27%  perfdemo  libm-2.27.so        [.] __ieee754_pow_sse2
+    7.09%     0.00%  perfdemo  [unknown]           [.] 0x4007ffffffffffff
+    4.44%     0.00%  perfdemo  libc-2.27.so        [.] __GI___libc_malloc (inlined)
+    4.43%     4.43%  perfdemo  libc-2.27.so        [.] malloc
+    1.29%     0.00%  perfdemo  [unknown]           [.] 0x00007fff109bcc2f
+    0.98%     0.98%  perfdemo  perfdemo            [.] __rdl_dealloc
+    0.98%     0.00%  perfdemo  perfdemo            [.] std::sys::unix::alloc::<impl core::alloc::GlobalAlloc for std::alloc::System>::dealloc (inlined)
     0.50%     0.00%  perfdemo  [unknown]           [.] 0x000056525f9d4a6f
     0.31%     0.31%  perfdemo  perfdemo            [.] fasteval::evaler::<impl fasteval::parser::BinaryOp>::binaryop_eval
     0.27%     0.00%  perfdemo  [unknown]           [.] 0xffffffffffffffff
     0.26%     0.26%  perfdemo  perfdemo            [.] __rdl_alloc
     0.26%     0.00%  perfdemo  perfdemo            [.] std::sys::unix::alloc::<impl core::alloc::GlobalAlloc for std::alloc::System>::alloc (inlined)
     0.22%     0.22%  perfdemo  libc-2.27.so        [.] __memmove_sse2_unaligned_erms
     0.22%     0.00%  perfdemo  libc-2.27.so        [.] __memcpy_sse2_unaligned_erms (inlined)
     0.21%     0.00%  perfdemo  perfdemo            [.] 0x000056525eaae9df
     0.18%     0.00%  cargo     libc-2.27.so        [.] __libc_start_main
     0.17%     0.00%  cargo     cargo               [.] main
     0.17%     0.00%  cargo     cargo               [.] std::rt::lang_start_internal
     0.17%     0.00%  cargo     cargo               [.] _start
     0.17%     0.00%  cargo     cargo               [.] std::panic::catch_unwind (inlined)
     0.17%     0.00%  cargo     cargo               [.] std::panicking::try (inlined)
     0.17%     0.00%  cargo     cargo               [.] __rust_maybe_catch_panic
     0.17%     0.00%  cargo     cargo               [.] std::panicking::try::do_call
     0.17%     0.00%  cargo     cargo               [.] std::rt::lang_start_internal::_$u7b$$u7b$closure$u7d$$u7d$::h7508d080ecc0582e (inlined)
     0.17%     0.00%  cargo     cargo               [.] std::rt::lang_start::_$u7b$$u7b$closure$u7d$$u7d$::h27e2708c839469d0
     0.17%     0.00%  cargo     cargo               [.] cargo::main
     0.16%     0.00%  cargo     cargo               [.] cargo::ops::registry::needs_custom_http_transport
     0.16%     0.00%  cargo     cargo               [.] cargo::ops::registry::http_proxy
     0.16%     0.00%  cargo     cargo               [.] git2::config::Config::open_default
     0.16%     0.00%  cargo     cargo               [.] libgit2_sys::init
     0.16%     0.00%  cargo     cargo               [.] std::sync::once::Once::call_inner
     0.16%     0.00%  cargo     cargo               [.] std::sync::once::Once::call_once::_$u7b$$u7b$closure$u7d$$u7d$::h879af7ebe2300f84
     0.16%     0.00%  cargo     libpthread-2.27.so  [.] __pthread_once_slow
Let's focus on this line:
91.56%/41.60% <fasteval::parser::Expression as fasteval::evaler::Evaler>::eval
As expected, most of the time is spent in eval() within the loop. If you know that you will be evaluating an expression many times, you can tell fasteval to compile it into a more efficient form:
use fasteval::Evaler;    // use this trait so we can call eval().
use fasteval::Compiler;  // use this trait so we can call compile().
fn main() -> Result<(), fasteval::Error> {
    // Allocate a block of memory:
    let mut slab = fasteval::Slab::new();

    // Pre-parse and Compile the expression:
    let parser = fasteval::Parser::new();
    let compiled = parser.parse("3^2 + 1", &mut slab.ps)?.from(&slab.ps).compile(&slab.ps, &mut slab.cs);

    for _ in 0..20_000_000i64 {
        // Evaluate the compiled expression:
        let val = fasteval::eval_compiled!(compiled, &slab, &mut fasteval::EmptyNamespace);

        assert_eq!(val, 10.0);
    }

    Ok(())
}
Let's see the performance:
$ time cargo run --release
real    0m0.048s
user    0m0.037s
sys     0m0.012s
20 million iterations in under 50 milliseconds -- a 190x improvement from where we started.
Performance Tip #1: Compile with RUSTFLAGS="--emit=asm"
Update: /u/Zoxc32 explains why --emit=asm has this effect: "Emitting files will force the compiler to use a single LLVM module for the entire crate which allows LLVM to optimize better. You can achieve a similar effect by passing -C codegen-units=1. Putting all the crates into a single LLVM module with -C lto=fat can also improve performance. These are not defaults since they slow down compilation times."
I'm listing this tip first because it's so easy to do (it's just a compilation flag, not a code change), and because it can result in a surprising performance boost. By emitting assembly files during compilation, LLVM is able to perform much better optimizations (particularly Variable Localization).
Let's demonstrate this with an example:
#![feature(test)]
extern crate test;
use test::{Bencher, black_box};

#[bench]
fn emit_asm_demo(ben:&mut Bencher) {
    let (a,b,c) = (1.0f64, 2.0f64, 3.0f64);
    ben.iter(|| {
        for _ in 0..1000000 {
            black_box(a + b + c);
        }
    });
}
Here's a comparison between normal compilation and compilation with ASM emission:
$ cargo bench
test emit_asm_demo ... bench:     685,107 ns/iter (+/- 99,740)

$ RUSTFLAGS="--emit=asm" cargo bench
test emit_asm_demo ... bench:     331,837 ns/iter (+/- 57,163)
...ASM emission makes it run twice as fast! It seems like ASM emission helps LLVM do a better job of Variable Localization (putting the data closer to the executing code). Sometimes, we can do this manually, for example:
#[bench]
fn manual_localization_demo(ben:&mut Bencher) {
    let (a,b,c) = (1.0f64, 2.0f64, 3.0f64);
    ben.iter(|| {
        let (a,b,c) = (a,b,c);  // Manual Variable Localization
        for _ in 0..1000000 {
            black_box(a + b + c);
        }
    });
}
...and now our code runs at the same speed with or without ASM emission:
$ cargo bench
test manual_localization_demo ... bench:     335,786 ns/iter (+/- 57,439)

$ RUSTFLAGS="--emit=asm" cargo bench
test manual_localization_demo ... bench:     333,922 ns/iter (+/- 33,784)
But for more complex situations, the compiler can usually do a better job than a person.
The benefits of RUSTFLAGS="--emit=asm" will vary, depending on your platform and code. Sometimes it will help performance, and other times it will hurt performance. You just need to try it and measure the results.
Performance Tip #2: Optimize the Critical Path
I'll say this again, since it's so important: ALWAYS PERFORM A release BUILD OF YOUR PROGRAM WHEN MEASURING PERFORMANCE. Measurements from a non-release build will be very misleading.
After you use a profiler to determine the "hot spots" in your code, you can gain a minor performance boost by applying some manual optimizations:
-
inline
pub: This is basic, but worth mentioning: If you want 'pub' functions to be inlinable across crates, you must mark them with#[inline]. -
panics: The compiler usually does a good job of optimizing panicky code, but sometimes panics can bog down your performance. Measure any code that can panic, and test out non-panicky alternatives.
-
indexing: When you use the index operator (
a[i]) on an array/slice/Vec/etc., bounds checks are performed, and a panic can be raised. For most situations,if let+get()tends to outperform other indexing techniques (including theunsafeones!) because it cannot panic and has excellent compiler optimization:Original: let v = a[i]; ... Usually Faster: if let Some(v) = a.get(i) { ... }
Performance Tip #3: Reduce Redundant Work
-
Memory: Memory operations are very slow and should be avoided if possible. Rust lifetimes and references help you to reduce memory operations by sharing data, rather than copying. fasteval also uses a
Slab-- a pre-allocated block of memory -- so it only needs to perform one big allocation instead of many little allocations. Also, theSlabcan be re-used, so subsequent evaluations don't need to allocate anything. -
Logic: It is often possible to improve the efficiency of your logic so that you can accomplish the same goal while doing less work. One example of this situation arises when parsing a string into an AST. The standard process goes something like this:
Step 1: Use a "tokenizer" to split the string into a list of tokens.
Step 2: Interpret the list of tokens to produce a list of AST nodes.
Step 3: Discard the list of tokens.
This structure is nice because it enables separation of the "tokenization" and "interpretation" logic. The down-side to this structure is the extra work that must be done at run-time: allocating and discarding the temporary token list, writing-and-reading the tokens to-and-from the list, and sharing the list between different parts of the program. fasteval uses a specialized parser that is able to generate an AST directly from a string, without using tokens. This produces the same result in less than half the time.
-
Data: When designing your data structures, try to make them "infallible" -- i.e. design them so that it is impossible to represent an invalid value. If you know that a value will always be valid, you don't need to perform validity checks at runtime.
Here is an easy-to-understand example from fasteval: the AST node representing a
min(...)variadic function call. Example usage ismin(3, 2.25, x, -4)or evenmin(3), butmin()with no args is not valid. Originally, I designed the data structure like this:struct MinFunc { args: Vec<f64>, }...but that structure is fallible -- args could be empty, and you can't take the minimum of nothing! Even though a zero-arg
min()call wouldn't make it past the 'parse' phase, I still had to do validity checks in the 'compile' and 'eval' code to defend against incorrect API usage. The 'eval' phase is in the critical path, so these validity checks really add up and hurt performance.I finally changed the data structure to this:
struct MinFunc {
    first: f64,
    rest : Vec<f64>,
}
This data structure is infallible -- it is impossible to create a value that represents a no-arg
min()call because we are guaranteed to have at least afirstvalue. This allowed me to remove all of those validity checks, which improved performance and safety.